Overview on Project
AddMin+ is a student developed application under the National University of Singapore’s CS2103T Software Engineering Module. The project required students to enhance a basic command-line interface desktop application which is the AddressBook - Level 3 that was developed by the se-edu team. The AddressBook - Level 3 is a desktop address book application that was designed to be used for teaching Software Engineering principles.
About AddMin+
The AddMin+ Team comprises of 5 Computer science students from AY1920S1-CS2103T-T11-3. The team decided to morph and enhance the capabilities of the original application into an all-in-one administration desktop application. The application is specially designed for the use of any events management start-up company that is faced with limited manpower and resources.
AddMin+ is specially designed to ease the workload of admin staff in these companies and allow them to effectively handle the administrative needs of the company by providing the following functions: event creation and deletion, editing of event details, manual and automatic manpower allocation for events and providing an overview of all important data for the administrator via statistical representation.
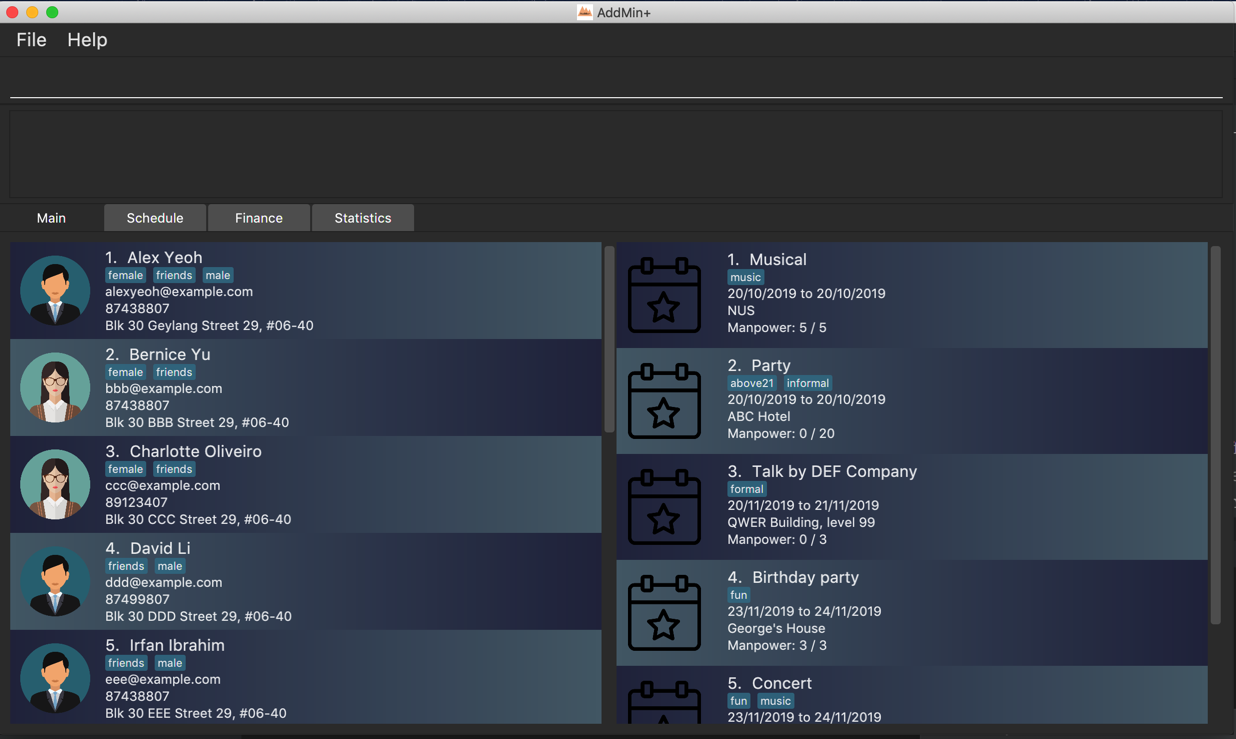
Below is an image of what AddMin+ displays to the user upon starting up.
The user interface for AddMin+.
My Roles and Responsibilities
My project responsibilities and tasking include being in charge of the group’s code quality via testing and finding bugs in the application.
While my coding related tasking was focused on designing and writing codes for the entire Statistics section of the project. The following sections will illustrate the enhancements in more detail, as well as provide relevant documentation that I have added to the user and developer guides in relation to those enhancements.
Before we start
The following symbols and formatting will be used throughout this document:
Text in a blue font and grey background indicates a hyperlink
Texts with a grey background indicates Code Logic such as class objects, OOP definitions or user-input.
Summary of contributions
This section will show a summary of all the features, enhancements, documentation, and other useful contributions that I have contributed to the team project.
-
Major feature: Implemented the entire Statistics segment of the project which includes major GUI modifications and 3 statistics related user commands.
-
What does it do: The Statistics section was implemented to allow users to have an overview of their app data, specifically on the employee and events. Thus, the
statistics,generate_statsandgenerate_stats_detailcommands were implemented. Thestatisticscommand or clicking the Statistics tab enables the user to enter the statistics mode to be able to use the other two statistics command. Thegenerate_statscommand or clicking the Generate Statistics button signals the app to generate a statistical representation based on the current data. Thegenerate_stats_detailcommand or clicking the Generate Detailed Statistics button signals the app to generate a text-based detailed statistics based on the current data. -
Justification: The Statistics feature improves the product significantly because it allows users to have a convenient way to view their events and employees data, specifically their tags. For an events administrator, it is important that they find the appropriate manpower to allocate to each event and the pie chart representation of the tags allows the user to determine quicly if they have the appropriate manpower available for the upcoming event or will they require more manpower.
-
Highlights: This enhancement required handling and dealing with both the
EmployeeandEventobjects. The implementation of the Statistics feature required an in-depth analysis of how the program deals with storage and retrieval of these objects while the app is running. The Statistics feature was also challenging as it was important to make the statistics displayed useful and relevant to the user. During the designing of the Statistics component, deep consideration was needed to ensure that the user interface was clean and optimal for the users, therefore, it was decided that pie charts would be a suitable visual representation for the employee and event tags data.
-
-
Minor features: Implemented the delete command to remove events easily via the
delete_ev #indexcommands based on the current list displayed on the User Interface and the list command to display both employee and events via the 'list' command. User Interface modifications were also done to provide intuitive user experience through simplicity. -
Code contributed: [tp Code Dashboard]
-
Logic (Command & Parser): [DeleteEventByIndex, ListEventsEmployees, StatisticsTab, GenerateStatistics, GenerateDetailedStatistics, AddressBookParser]
-
UI: [MainWindow, StatisticsBox, StatisticsWindow]
-
-
Other contributions:
-
Project management:
-
In-charge of keeping code quality checked and reviewing new pull requests.
-
In-charge of List and Delete event commands for AddMin+ (Pull requests #84, #85)
-
In-charge of the entire Statistics feature of AddMin+ which includes 3 statistics related commands (Pull requests #96, #106, #107, #108, #234, #237)
-
Assisted in morphing the UI of AddMin+ (Pull requests #246, #255) (Pull requests #92)
-
Assisted in debugging AddMin+ based on User Feedback and Mock Practical Exam Feedback (Pull requests #286)
-
-
Documentation:
-
Community:
-
Contributions to the User Guide
The original user guide has been updated to document the new capabilities of the AddMin+ functionality. The following are excerpts from the AddMin+ User Guide, which will showcase the sections that I have contributed to, in particular, the Statistics section of the UG. This will showcase my ability to write documentation for end-users. |
Statistics
Generate Statistics: generate_stats
Displays a set of statistics, Number of events, Number of employee etc
Format: generate_stats
Example: To generate list and pie chart statistics on demand.
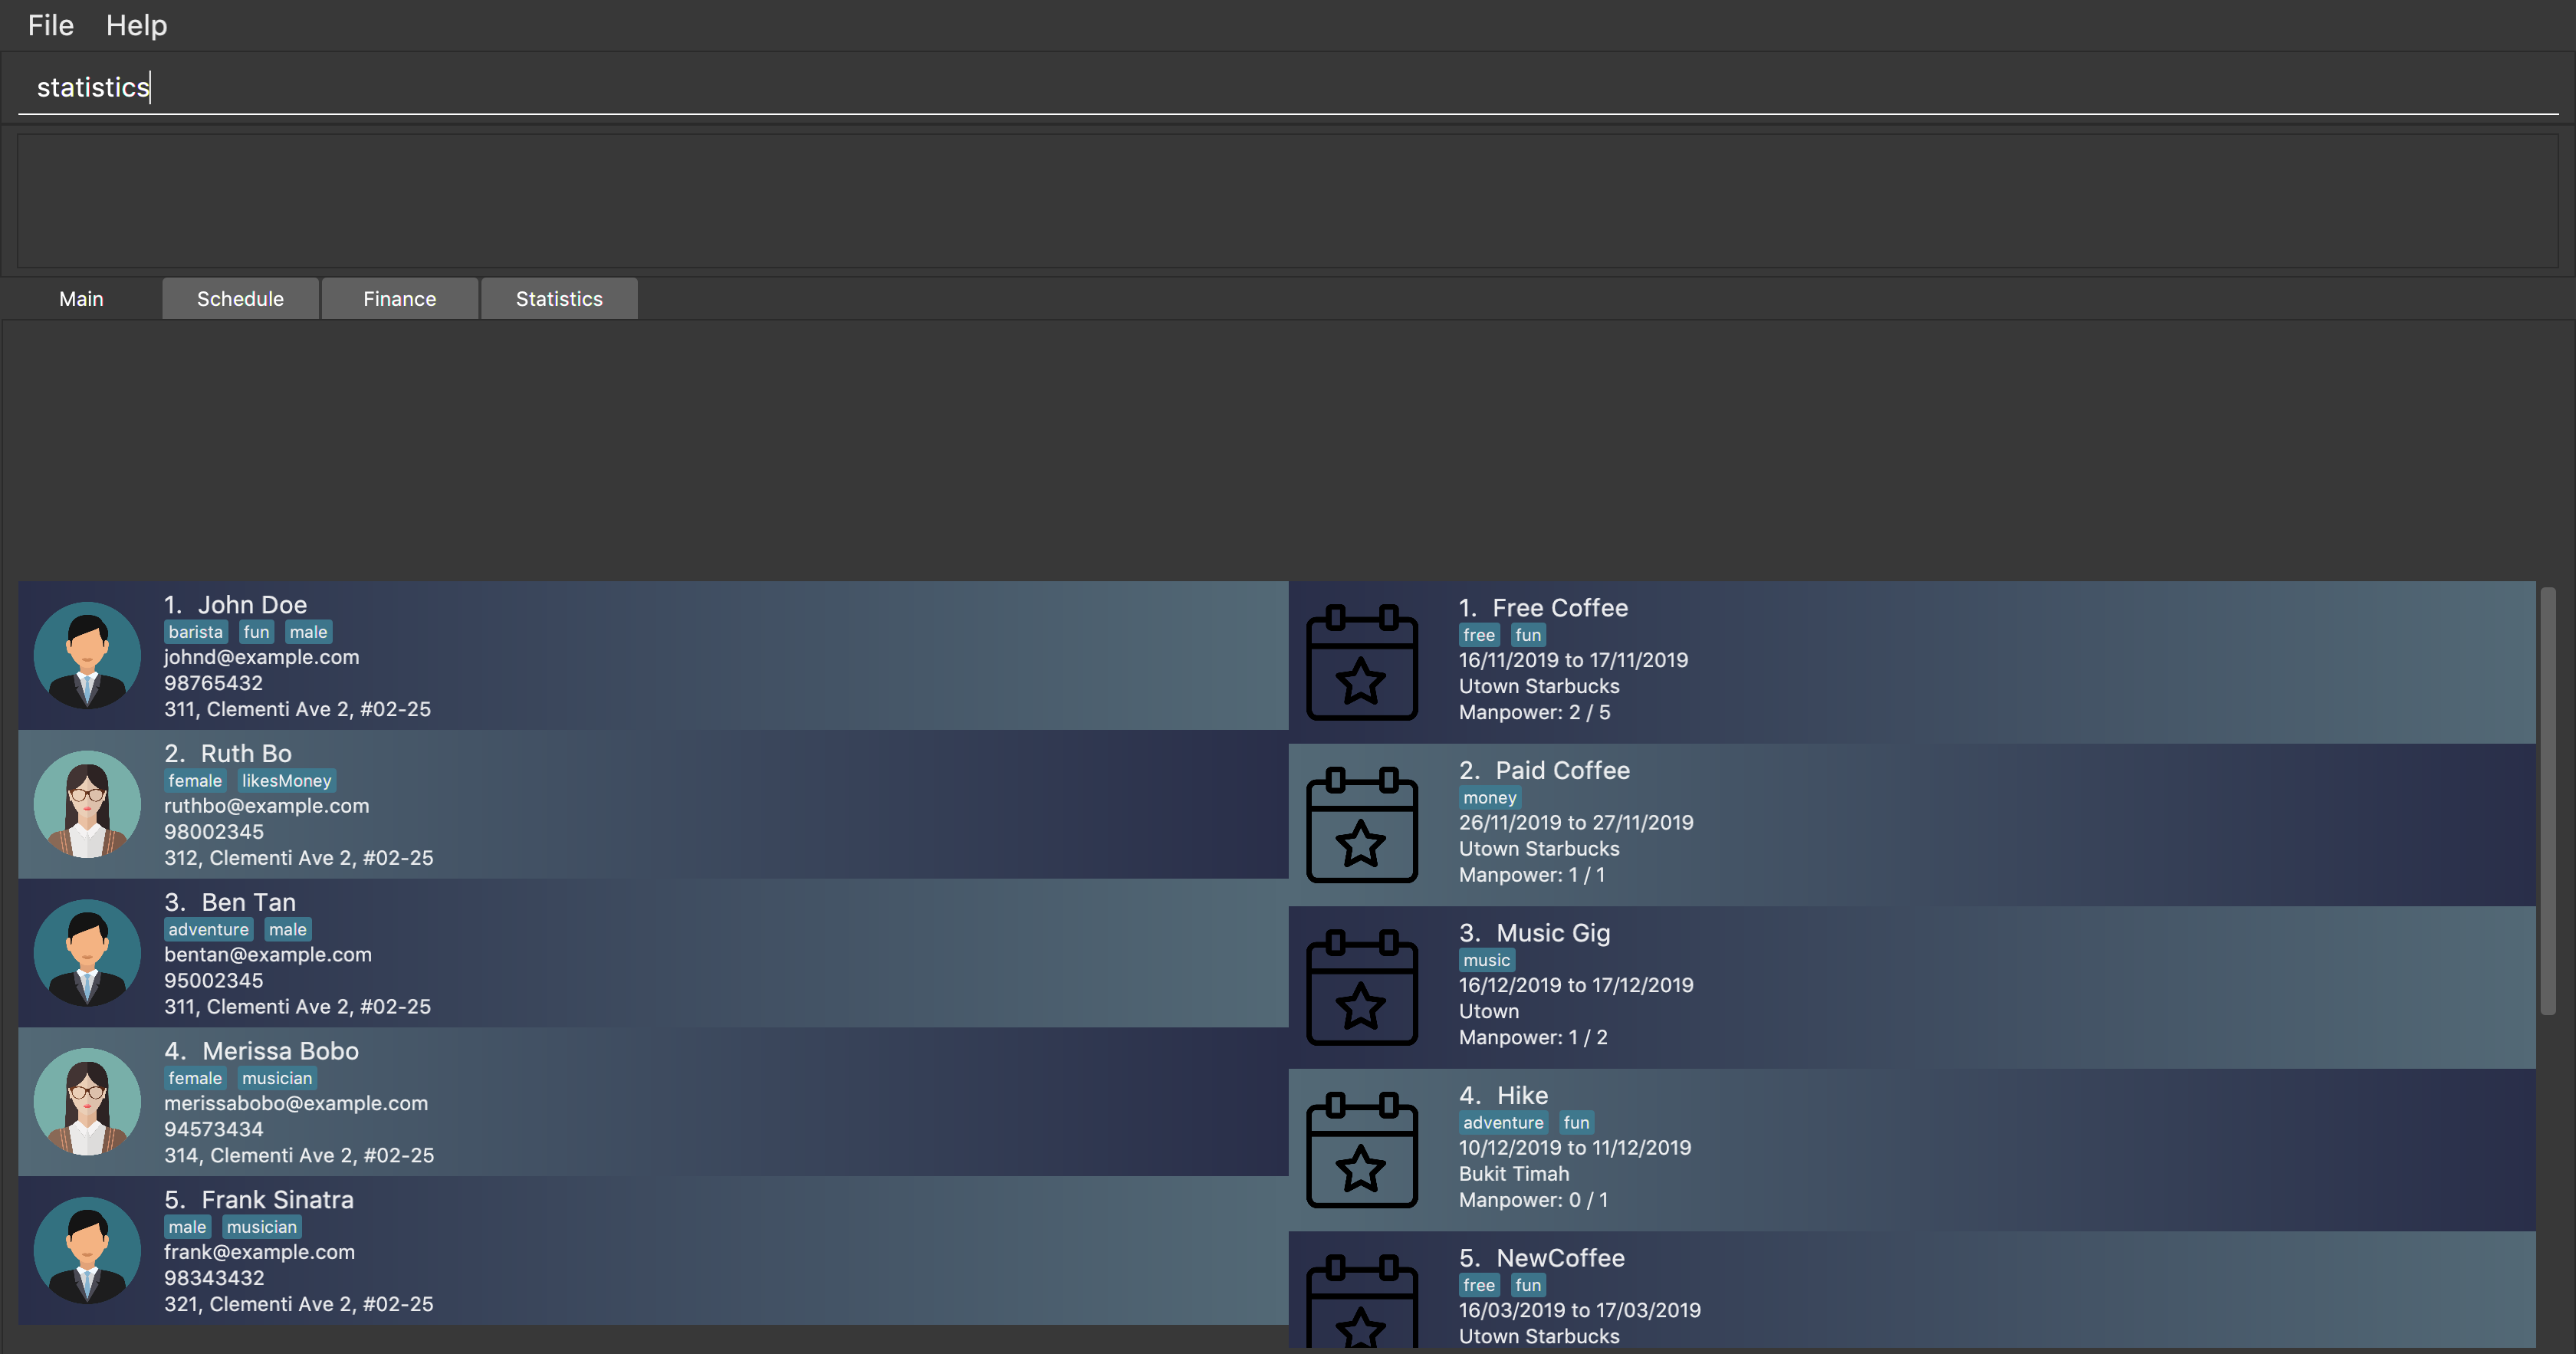
Step 1.
Navigate to the statistics tab either using the mouse to click the statistics tab or by typing statistics command.
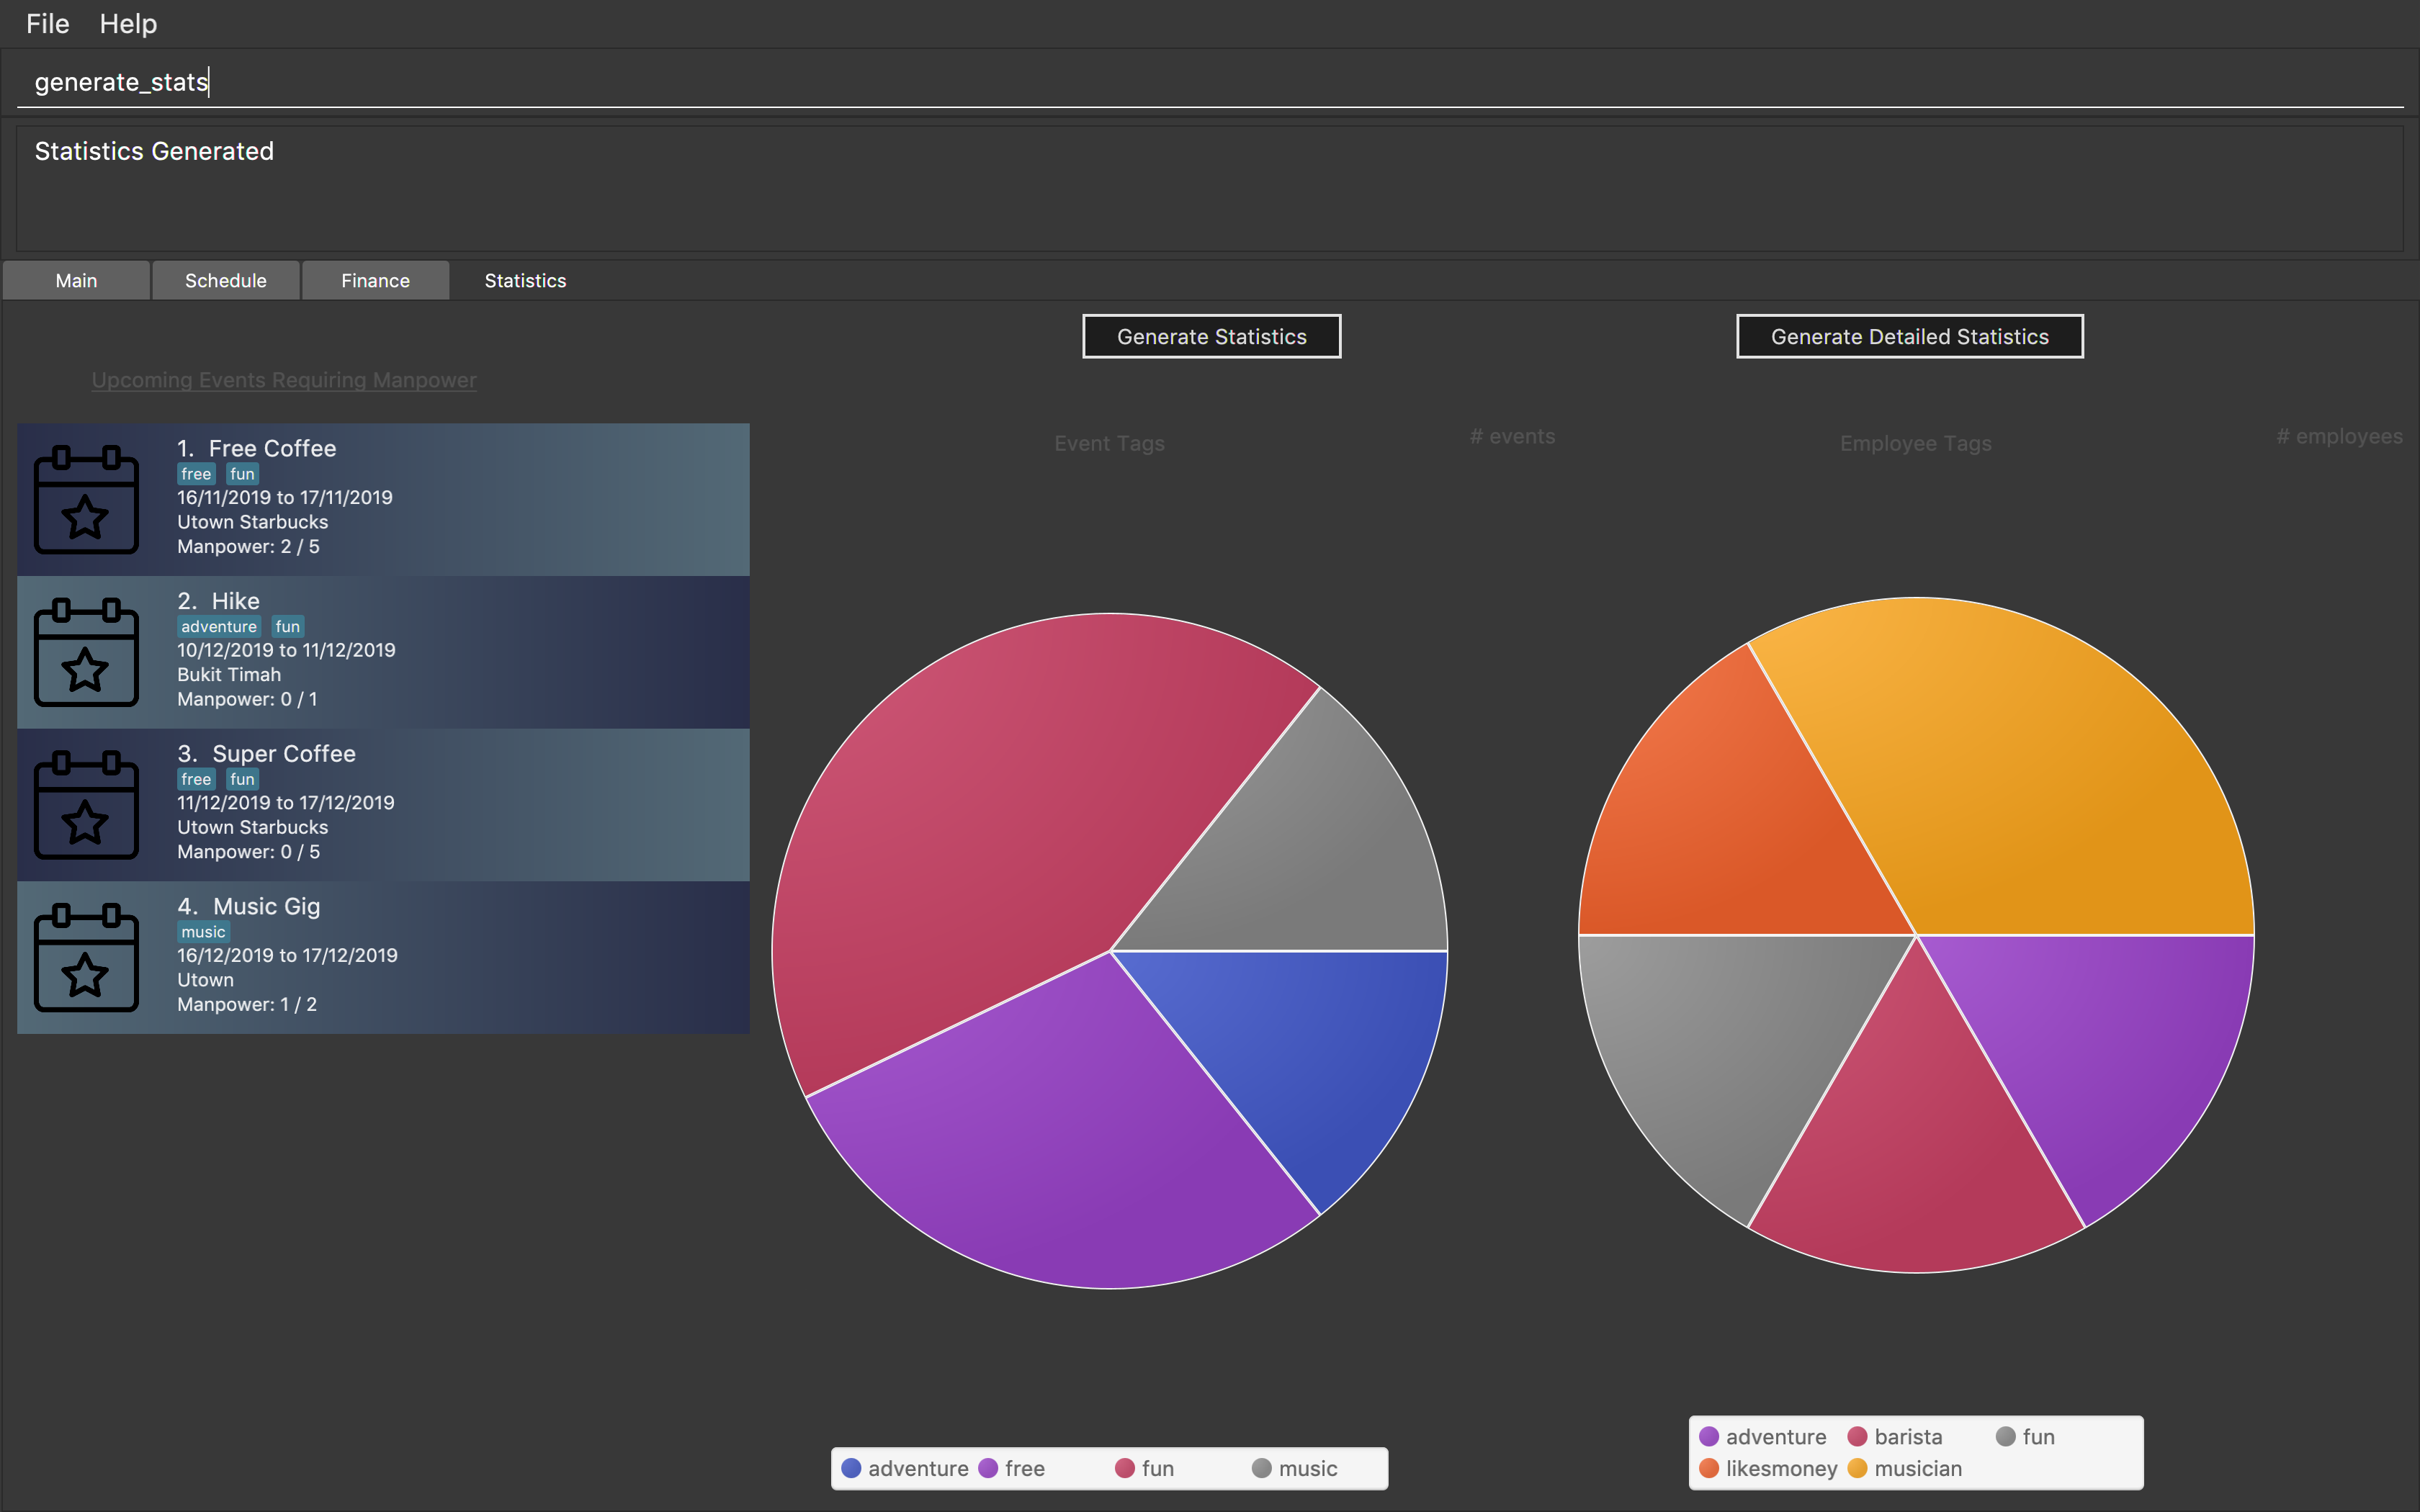
Step 2.
Generate the statistics either by using the mouse to click the generate statistics button or by typing generate_stats command.
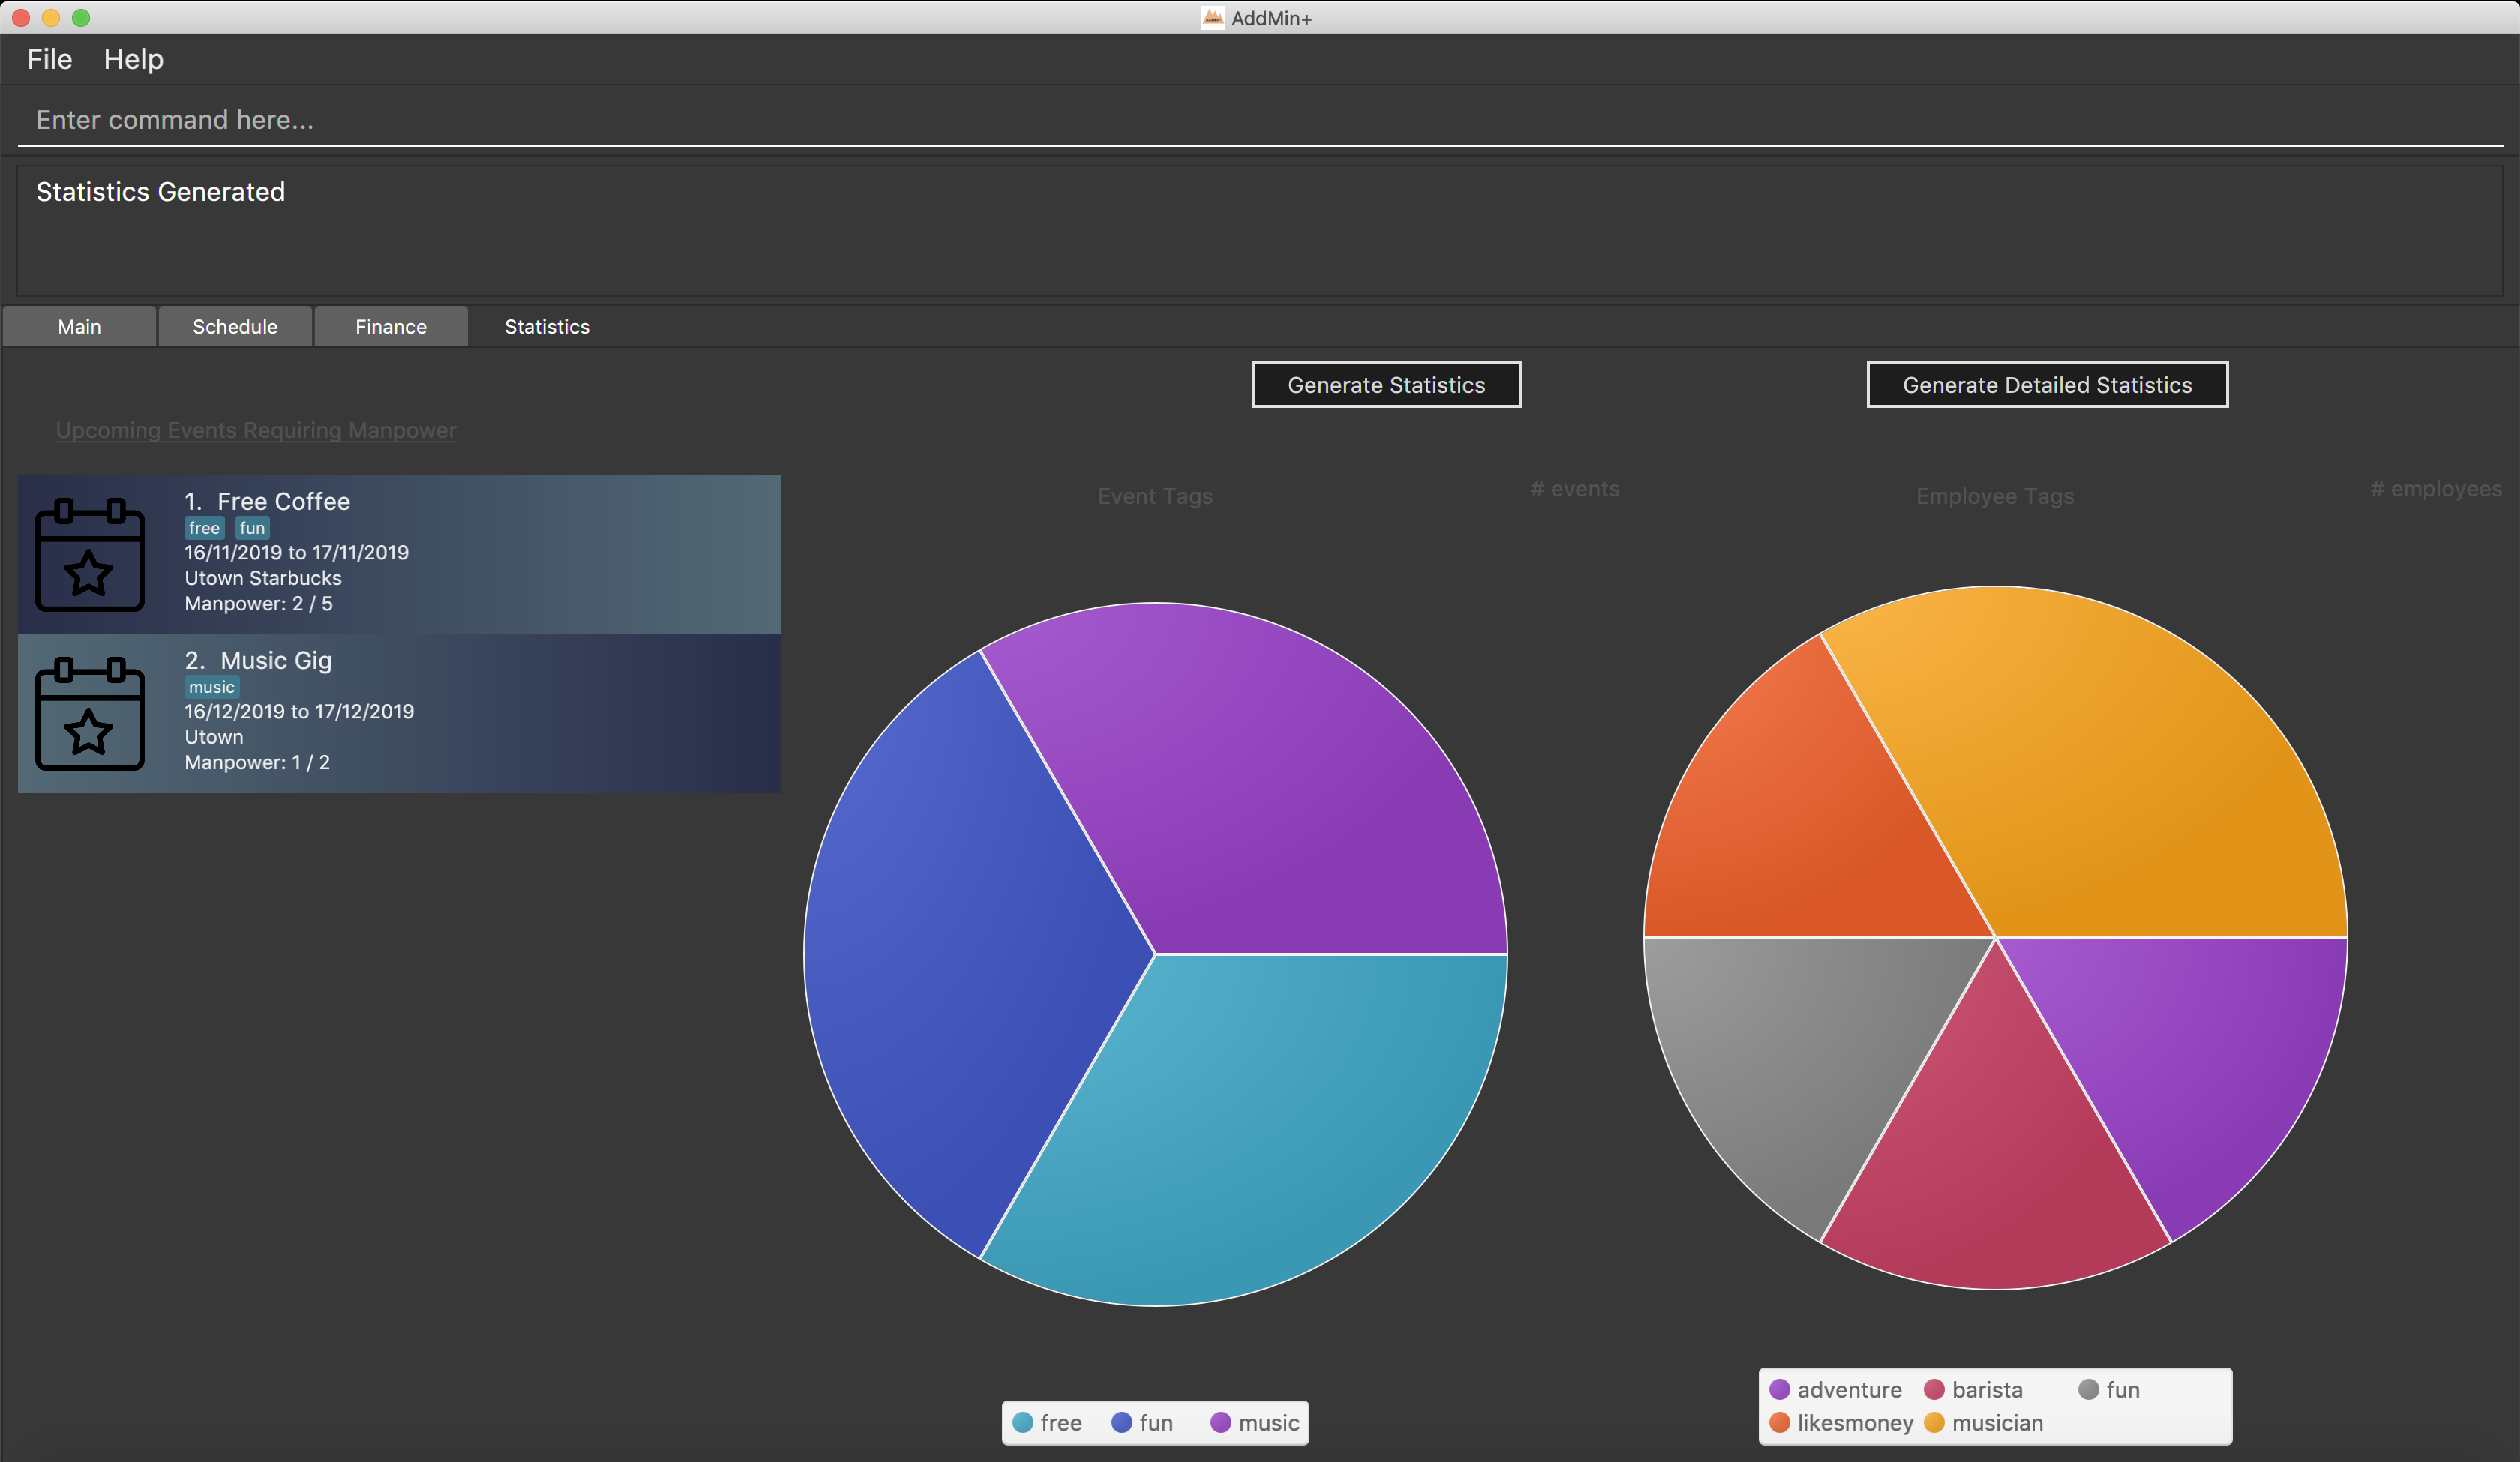
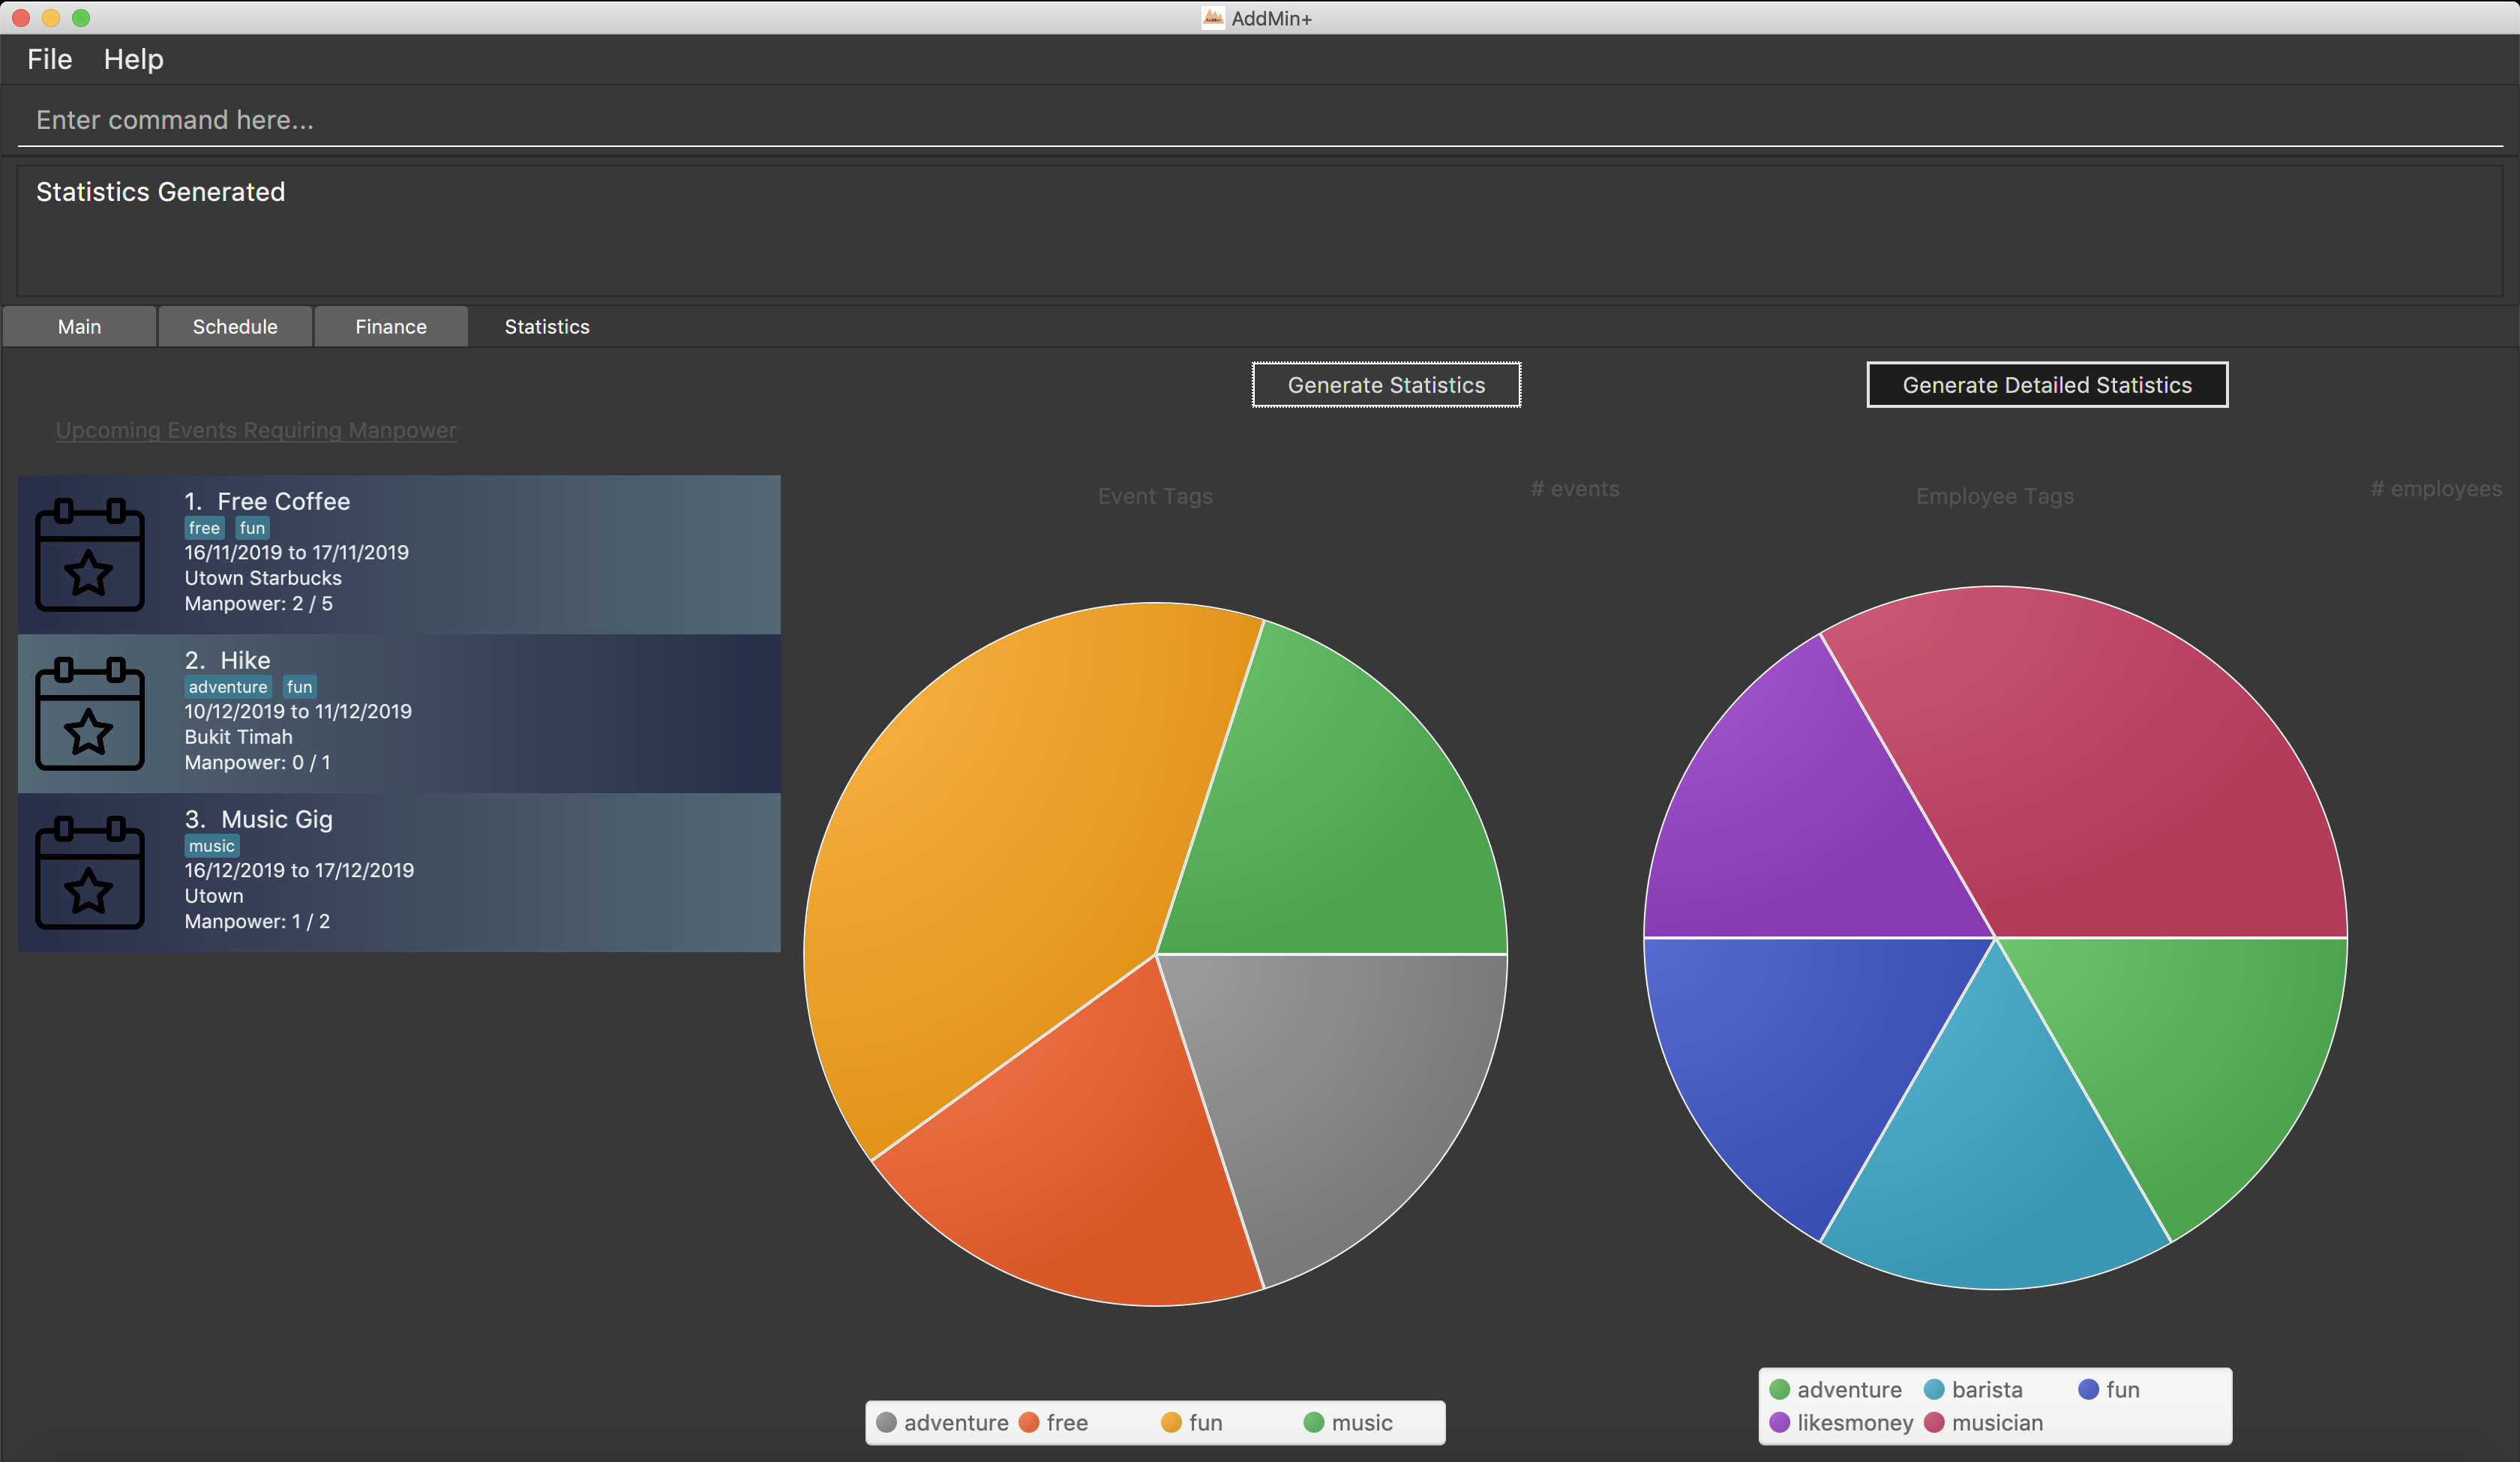
Step 3. Statistics will be displayed in 2 different types of views: list and pie chart. The list will display the upcoming events that require manpower sorted from the nearest upcoming date to the furthest date. The pie charts represent the upcoming events that require manpower and employees tags respectively. This is done this way to help the user identify efficiently if they have sufficient employees with matching tags for the event or if more employees may need to be hired to match the tag of the upcoming event. For example, a music event will have a 'music' tag and an employee who plays the guitar will have a 'musician' tag. The pie charts will reflect that there is one event under the 'music' tag and one employee under the 'musician' tag.
Step 4. To allocate an employee to an upcoming event, double-click the event on the list and it will display the allocate function covered earlier in the User Guide. The segments on the pie charts can also be clicked to display the number of events or employees associated with that specific tag on the top right corner of each of the pie charts.
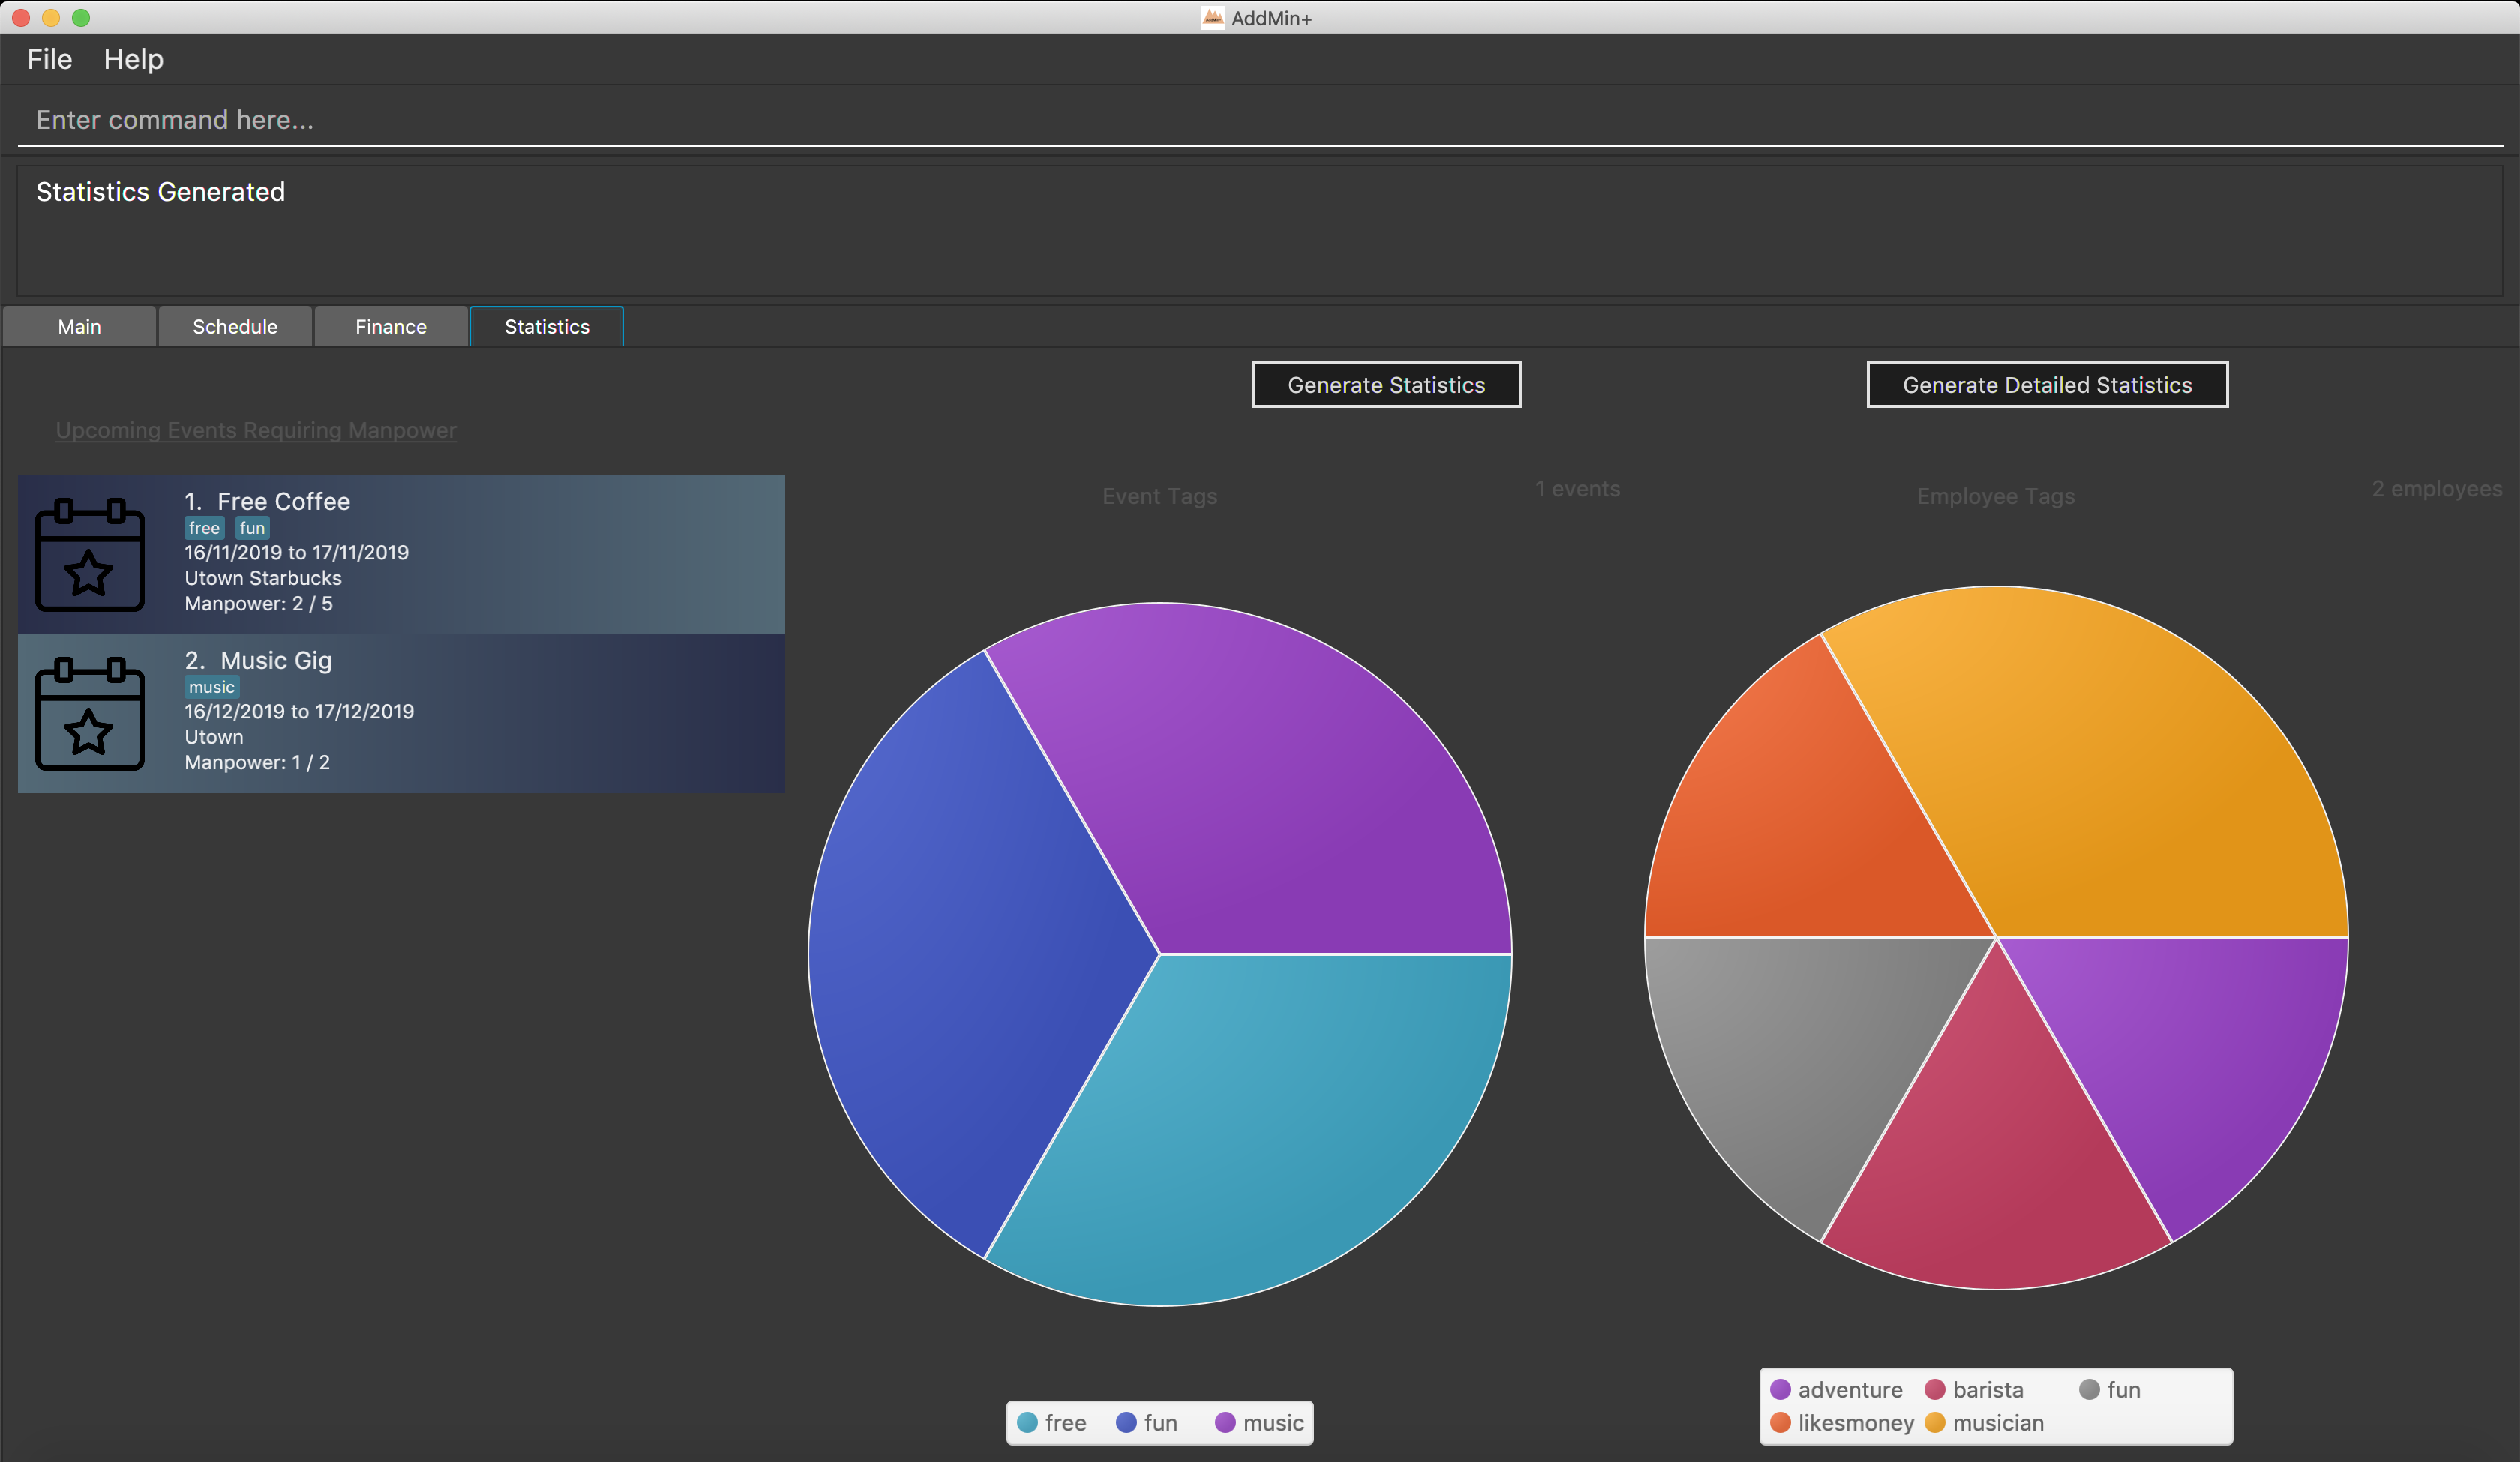
Step 5. Generate statistics manually when any change in data occurs to keep the statistics up to date and relevant.
Generate Detailed Statistics: generate_stats_detail
Displays a set of statistics, Number of events, Number of employee etc
Format: generate_stats_detail
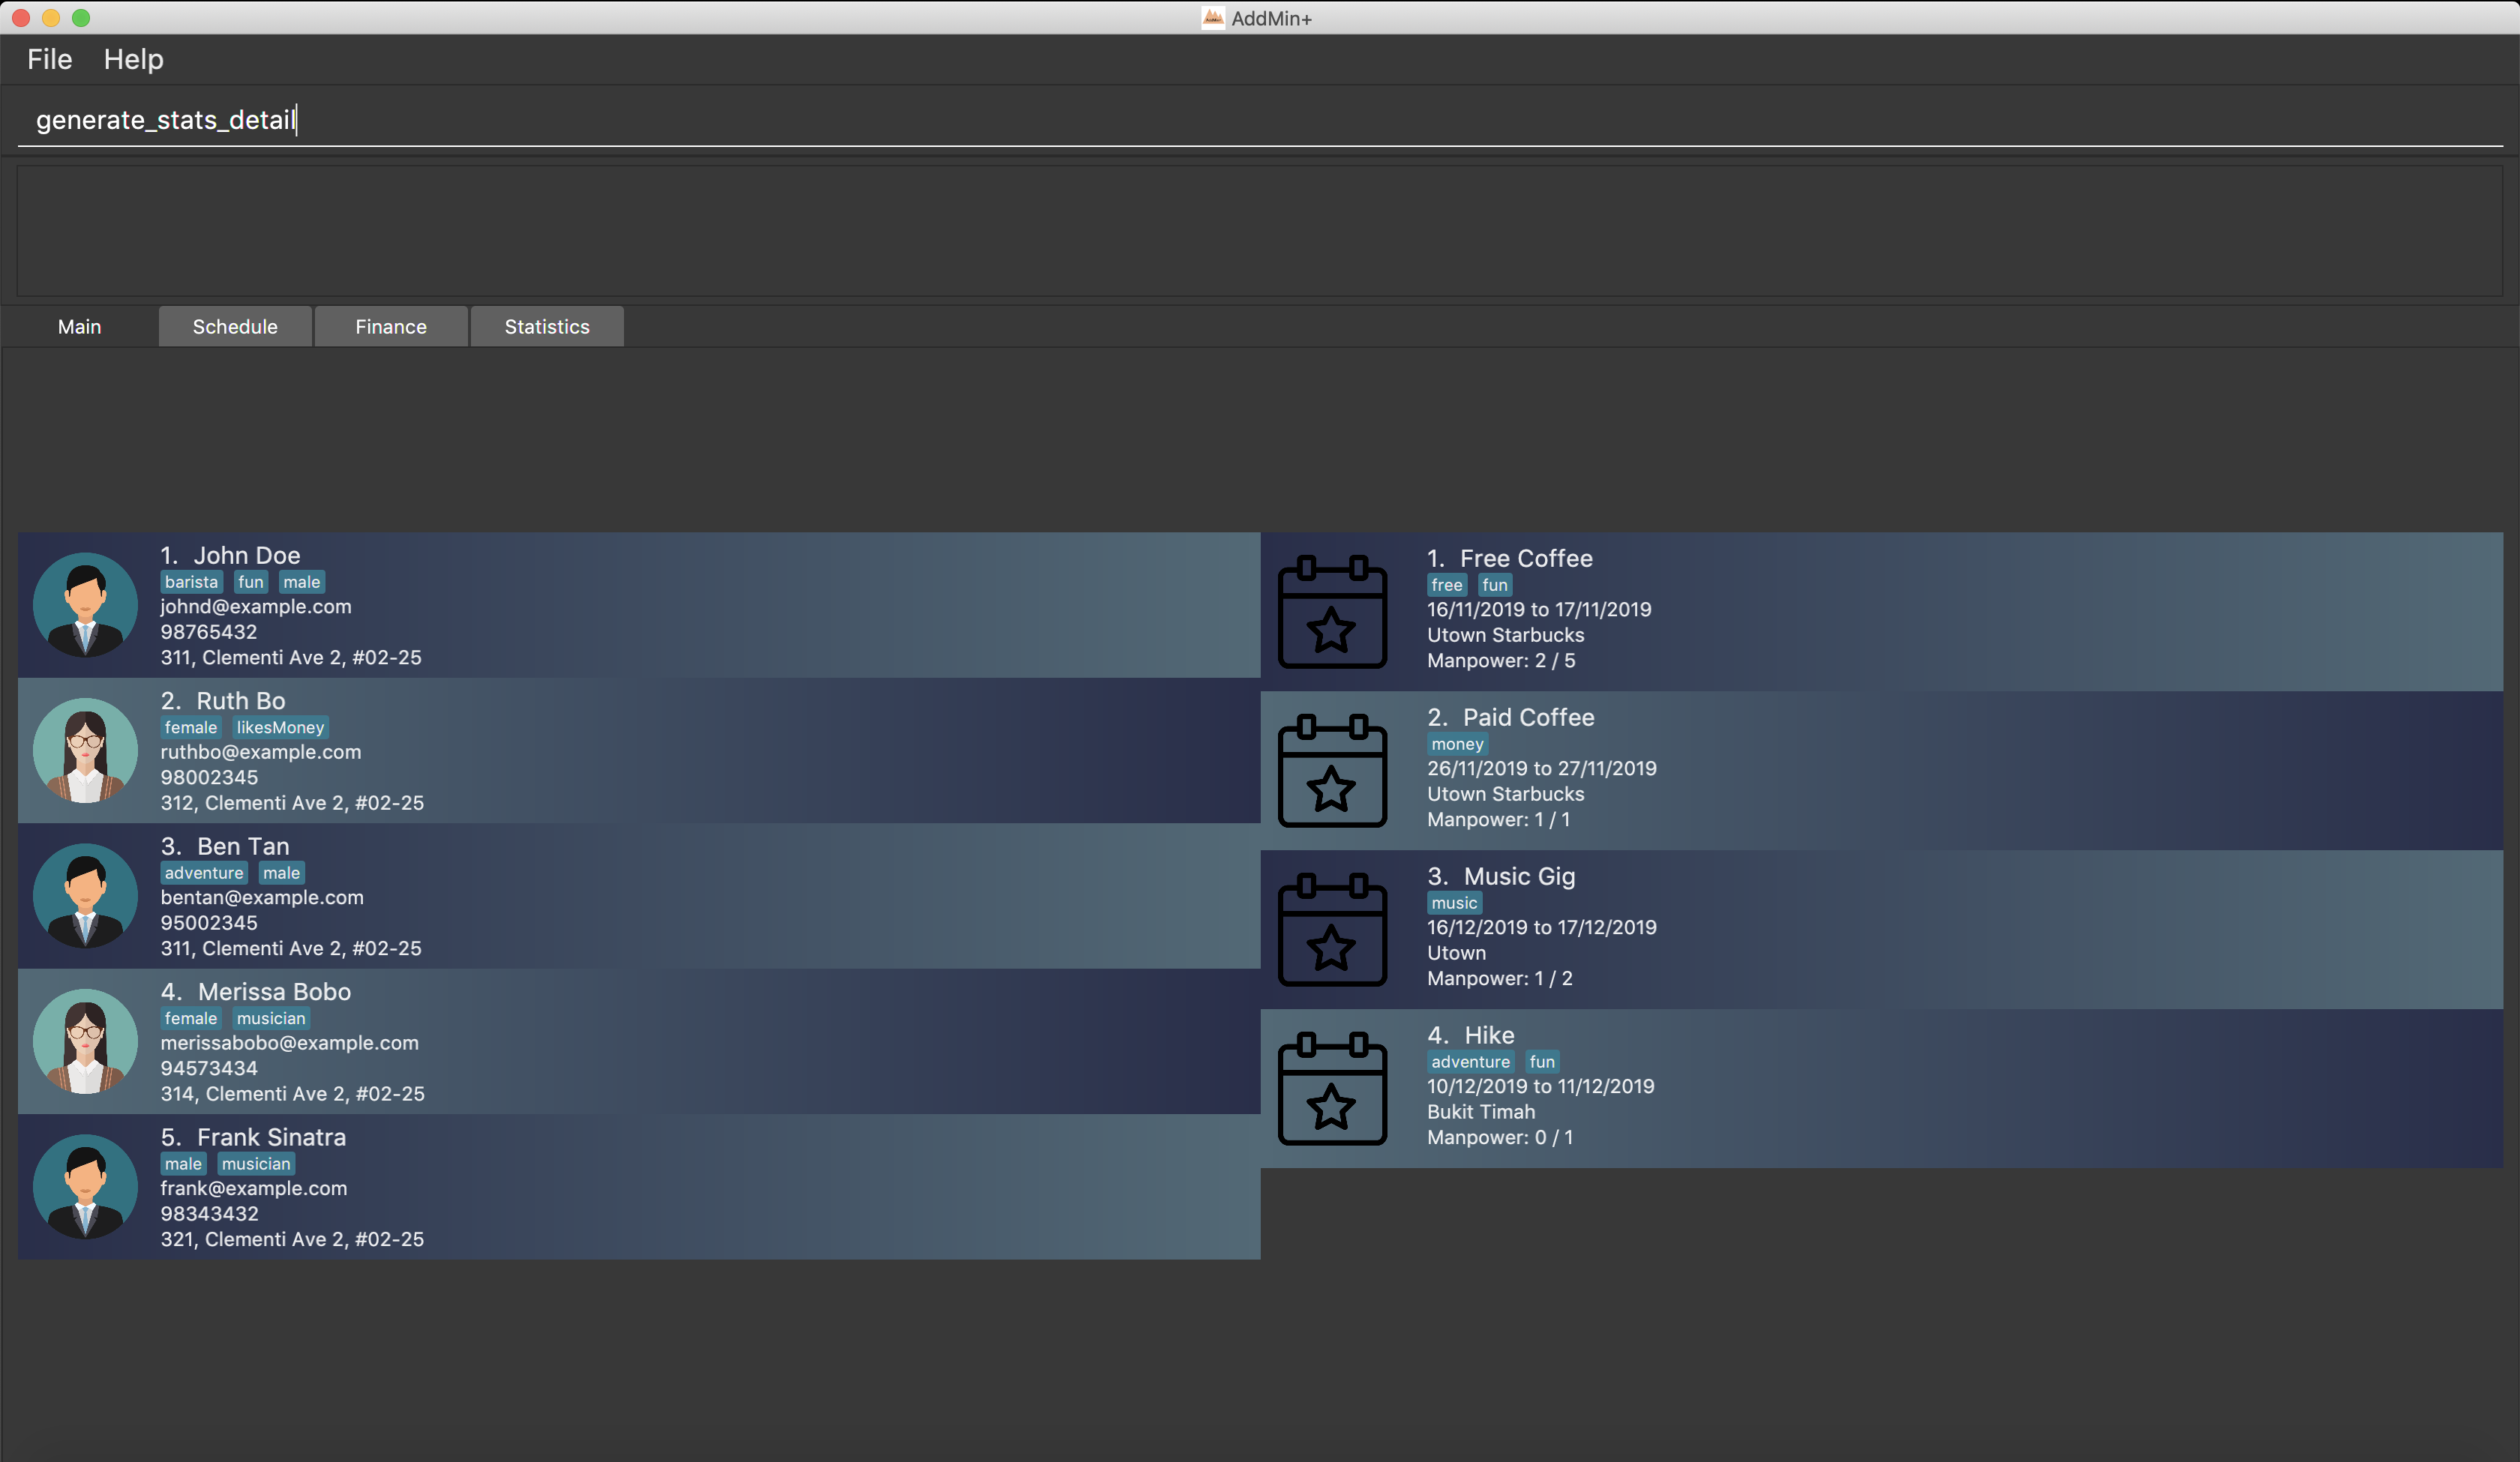
Example: To generate detailed statistics in plain text format on demand.
Step 1.
Either type generate_stats_detail into the command box or navigate to the statistics tab and click the 'Generate Detailed Statistics' button.
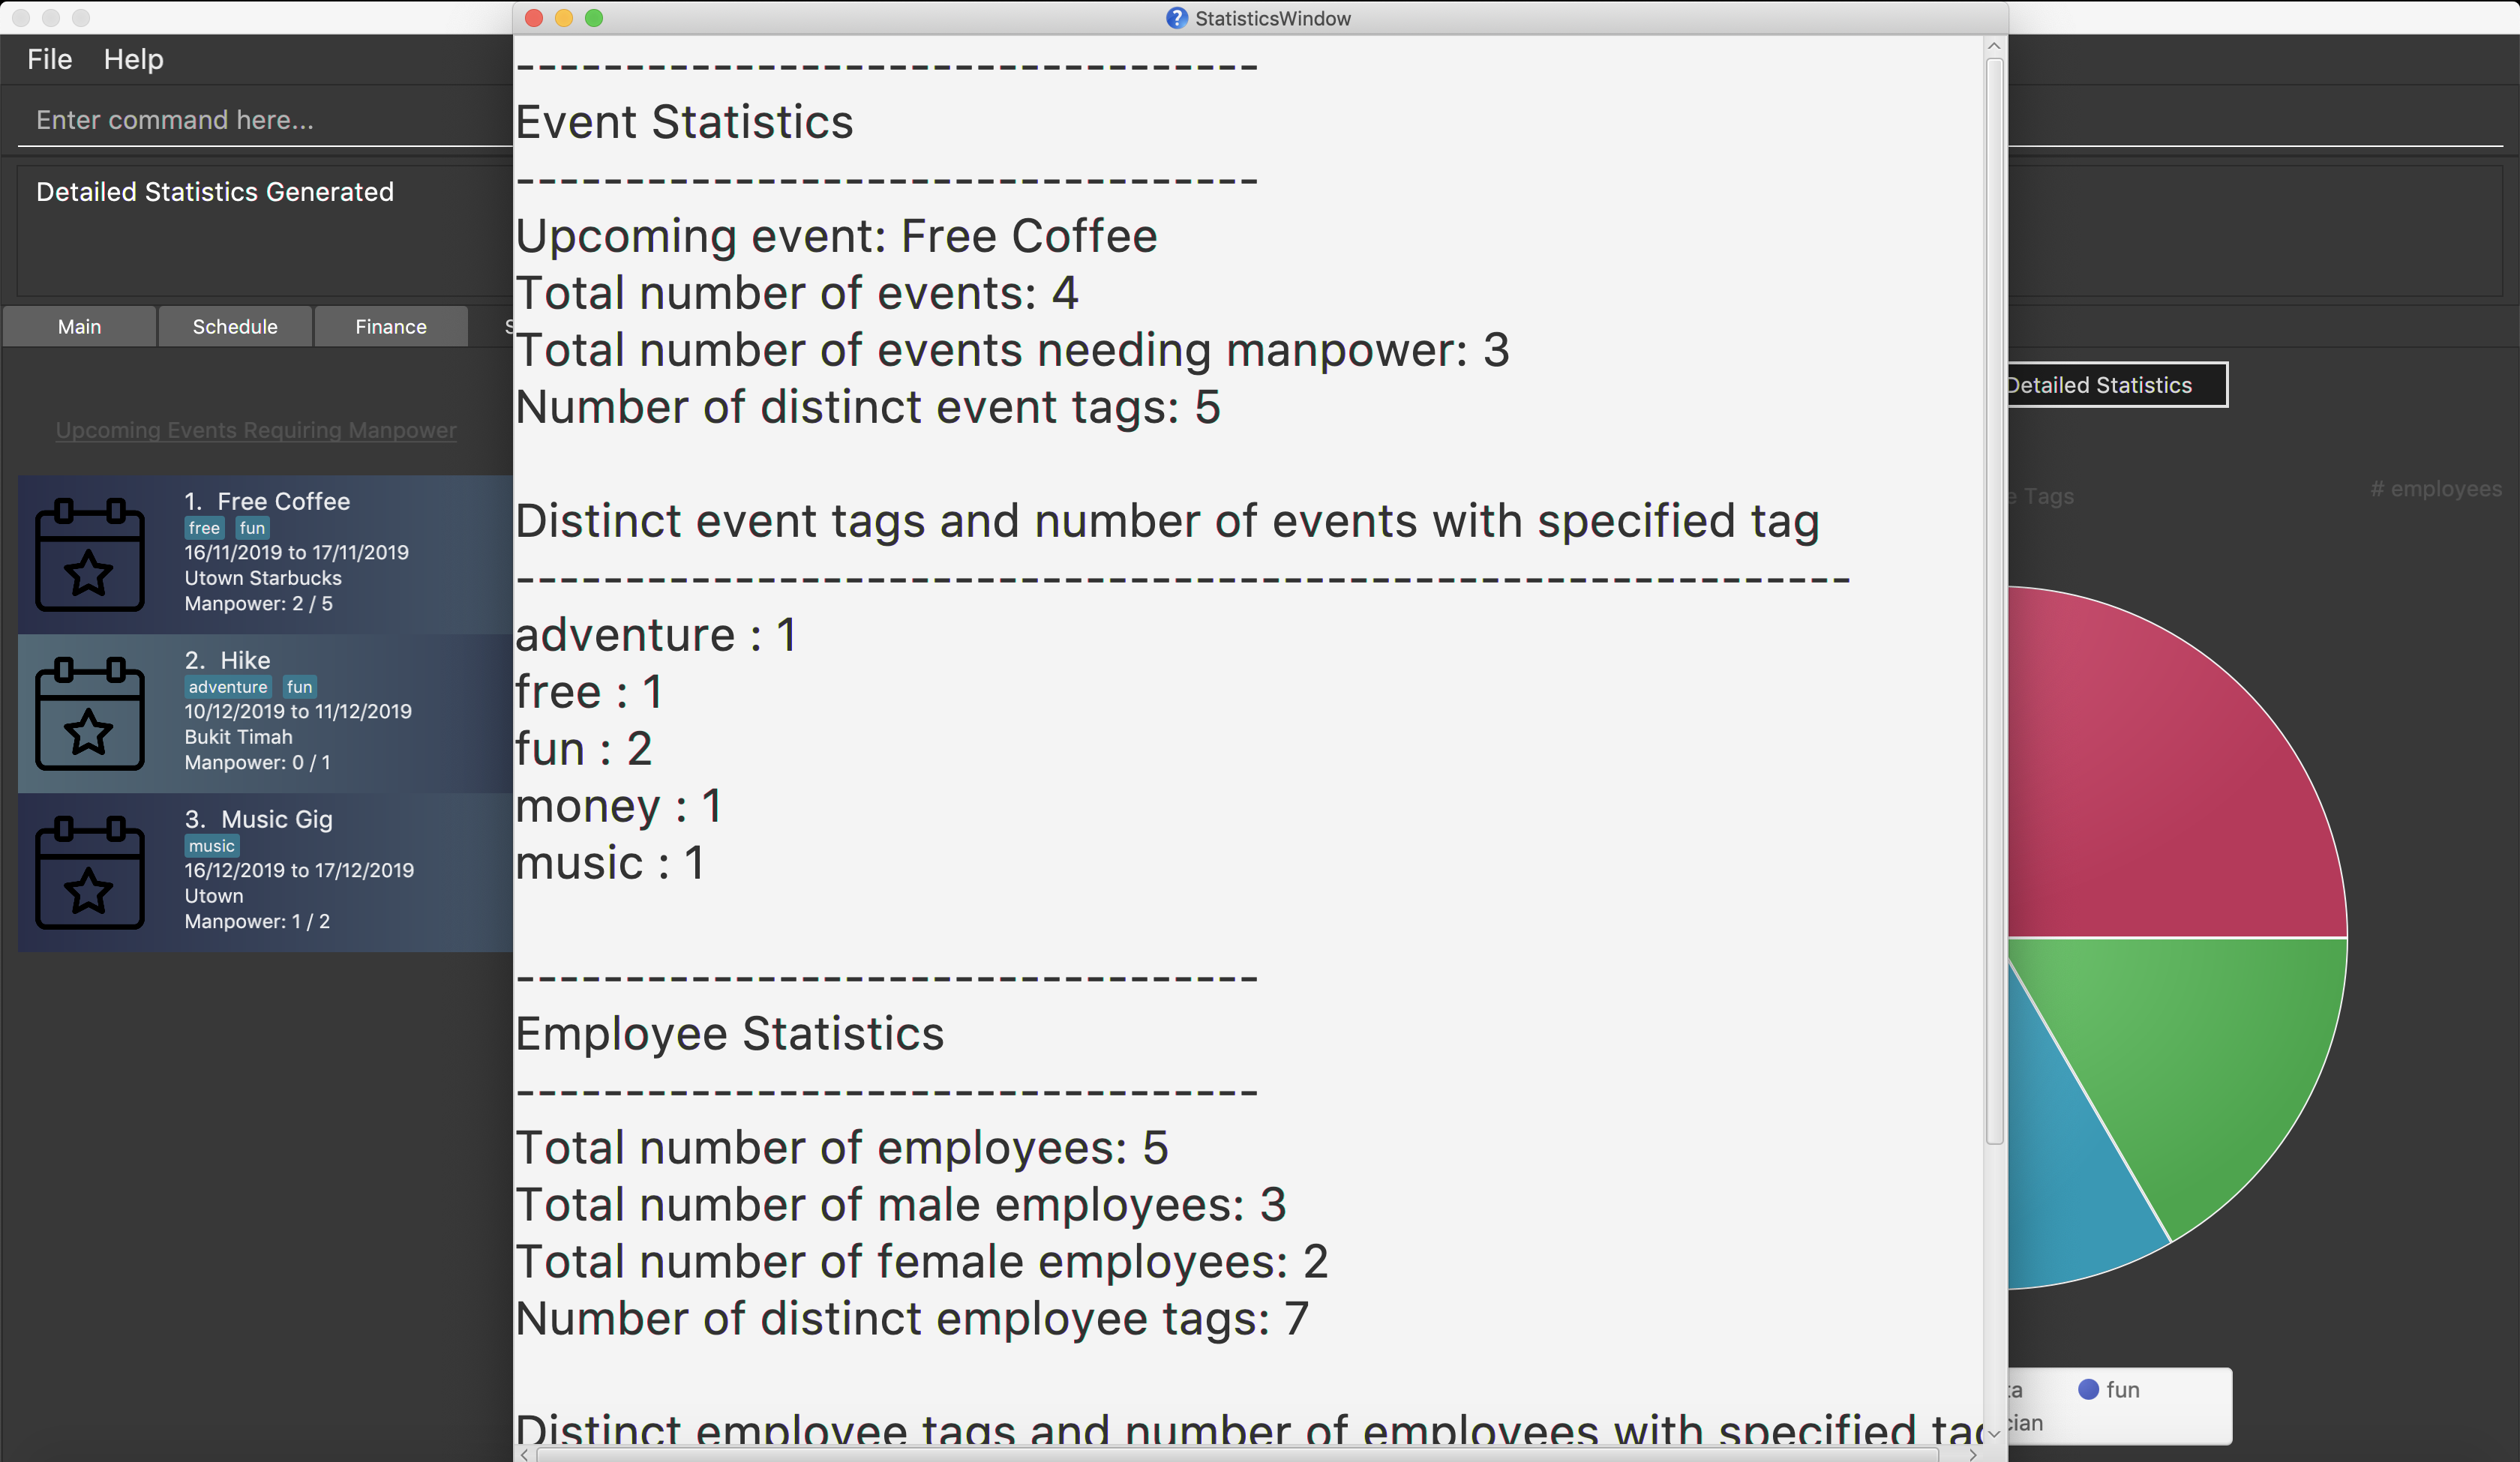
Step 2. A pop-up window with the header "StatisticsWindow" will appear displaying statistics for both employees and events.
Contributions to the Developer Guide
Given below are sections I contributed to the Developer Guide. The section will cover the design considerations and
design code structure of the |
Statistics feature
Implementation
Given below is an example usage scenario and how the statistics mechanism behaves at each step.

Step 1. The User executes the jar file to start up the program.
Step 2. The program initializes app with the stored JSON data.
Step 3. The user executes commands related to employees and events.
Step 4. The user executes either the generate_stats and generate_stats_detail command.
Step 5. If the generate_stats command is executed, the event list and pie charts will be updated to
reflect the latest data and will be displayed in the statistics window.
If the generate_stats_detail command is executed, a pop-up window displaying detailed statistics
in rich-text format will appear.
Step 6. User runs the generate_stats and generate_stats_detail command whenever there
are any changes to the data, like a new event or an employee that left so as to get the
get the most current statistics based on the new data.
Design Considerations
Aspect: How statistics executes
Alternative 1 |
Alternative 2 |
|
Consideration 1: |
Processes the data and generates statistics upon Pros: Cons: |
Generate statistics each time there is change in the data and store them. Pros: Cons: |
Why We chose Alternative 1: |
||
Conclusion:
In conclusion, the AddMin+ application was developed in conjunction with the CS2103T and CS2101 modules offered by the School of Computing. The process of going through each stage of the software development lifecycle has been a valuable and unique experience for all of us. Being students, many of us are yet to have experienced how software engineering is done in the industry and these modules have given us an early insight on what to expect in the future.
Personally, one of the biggest challenges I faced while undertaking CS2103T, was the developing of code on top an existing code base. The process of understanding what has been done so far before building on top of that is tedious and takes a fair amount of time. However, it has helped me learn that software engineering is not only about writing code but more of a form of communication between people and I can see now that it is important that I understand what other engineers are trying to say before I perform my tasks.
Beyond the code, I have also been exposed to the importance of being able to communicate on a human level through the CS2101 module. Although the scope of the software engineer is to develop code, I have learnt that there is much more to building a product than just coding. Connecting with others eventually plays a big part on whether or not a product is able to launch and stay successful.
I would like to thank my lecturers and fellow team mates for their guidance and understanding throughout this entire process and without whom I would not have been able to achieve this milestone.